


Multilingual SEO analytics means measuring search performance separately for each language version of your site instead of as one global total. In practice you filter Google Search Console by language folder and country, segment Google Analytics 4 by the same language path, and compare impressions, CTR, rankings and conversions market by market so you know which locale to fix or fund next.
Below is how to set that up, which numbers to watch, and how to read the patterns that show up.
Key takeaways
- Segment by the URL of each language version (
/de/,de.example.com) rather than by the visitor’s browser language. That only works if every language has its own indexable URL. - In Search Console, use a page filter for each language plus a country filter. Regex filters let you group many pages at once.
- In GA4, build a “language version” dimension from the page path. GA4’s built-in Language dimension is the browser setting, which is a different thing from the page language.
- Read each market on its own. Impressions show demand, CTR shows whether your translated titles earn the click, and conversion rate shows whether the localized page does its job.
- Review monthly, re-rank markets quarterly, and check hreflang and indexing whenever a locale drops suddenly.
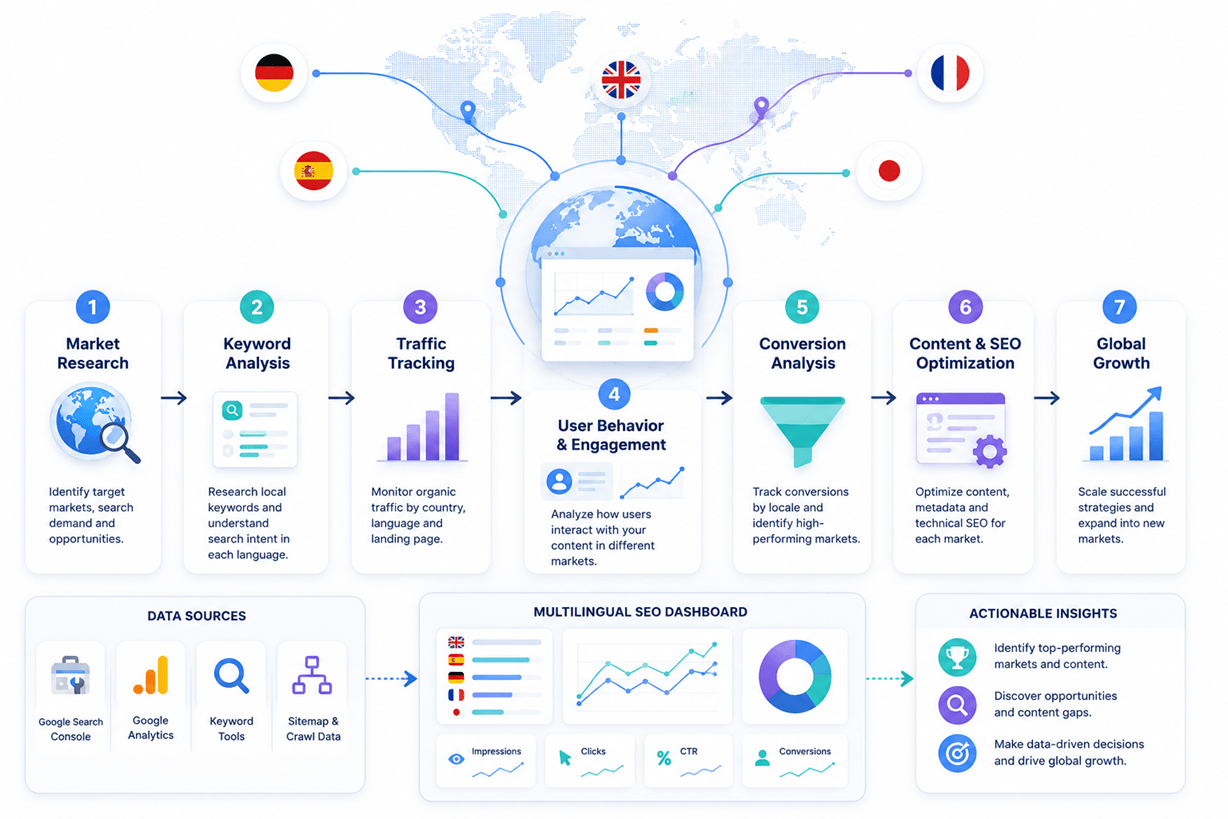 The loop: research markets, measure each language separately, review in a dashboard, fix, repeat.
Why site-wide totals mislead
Picture a SaaS site in English, Spanish, German and French. Global organic traffic is up 20%, so the report looks healthy. Split it by language and it reads differently:
- German has modest traffic but converts well.
- Spanish has the most sessions and the weakest engagement.
- French gets plenty of impressions and few clicks.
- English still gets most of the branded search.
One line chart shows none of this. Each problem has a different fix (better German content, a better Spanish landing experience, better French titles), and you only see them when every report is split by language.
Step 0: make sure each language is measurable
Analytics can only separate what search engines can separate. Before you measure anything, check that:
- Every language has its own URL: a subfolder (
/de/), subdomain (de.example.com) or separate domain. A translation that only appears after a cookie or script runs will not show up in Search Console as its own set of pages. Google recommends distinct URLs for each language and advises against switching content by IP or browser settings (Google Search Central). - Hreflang tags are in place and reciprocal, so Google shows the right version to the right audience. See our complete hreflang guide.
- Titles and meta descriptions are translated. Untranslated metadata is the most common reason for poor CTR in non-English markets.
- Your analytics tag loads on every language version, subdomains included, and those subdomains are covered by the same GA4 data stream or a cross-domain setup.
If your language versions live on subdomains, add each one to Search Console as its own property, or use a Domain property that covers them all.
Step 1: Search Console by language
Search Console shows you demand (impressions), visibility (position) and how often people click (CTR) for each language.
Start by filtering on the language folder. In the Performance report, add a Page filter. For a single language, “URLs containing /de/” is enough. To group several, choose Custom (regex). Search Console uses RE2 regular expressions, so for example:
/(de|at|ch)/groups German-language folders for three markets./(de|fr|es)/with Doesn’t match regex isolates your source-language pages when the other languages sit in folders. (RE2 has no lookaheads, so use the “doesn’t match” option instead of writing a negative pattern.)
Then add a country filter. If a German page earns most of its impressions outside Germany, Austria and Switzerland, there is usually an hreflang or targeting problem.
Use Compare to set the last 28 days against the previous period for each language. If impressions rise and clicks stay flat, your snippets are the problem, not your rankings.
Finally, check indexing for each language. In the Pages (indexing) report, filter by the same folder. A language where most URLs sit in “Crawled, currently not indexed” or “Alternate page with proper canonical tag” has a technical problem rather than a content one.
To get the same data outside the interface, use the Search Console API or the free Looker Studio connector. Both support page and country dimensions, and that is how most teams build a dashboard per language.
Step 2: GA4 by language version
GA4 tells you what happens after the click, with one trap. Its built-in Language dimension is “the language of a user’s browser or device,” and Country is where the activity came from (GA4 dimensions reference). Neither tells you which language version of your site someone used. A Spanish speaker in the US with an English browser who reads your /es/ pages shows up as English, United States.
Segment by the page path instead:
- In Explore, create a free-form exploration.
- Add the dimensions Landing page + query string, Session default channel group and Country.
- Add a filter: Session default channel group exactly matches Organic Search.
- Add a filter on Landing page for each language folder, or create a custom content group (set in your tag) whose value is the page language.
For subdomains, use Hostname as the language dimension instead of the path.
Then add the metrics you care about: sessions, engaged sessions, engagement rate, key events (conversions), and revenue if you track it.
Step 3: the metrics worth tracking per market
| Metric | Where | What it tells you |
|---|---|---|
| Impressions | Search Console | Demand you are visible for in that language |
| Average position | Search Console | How competitive your localized pages are |
| CTR | Search Console | Whether translated titles and descriptions earn the click |
| Indexed pages | Search Console | Whether search engines accept the language version at all |
| Organic sessions | GA4 | Traffic delivered to that language version |
| Engagement rate | GA4 | Whether the page matches local intent |
| Conversion rate | GA4 | Whether the localized journey (prices, trust, checkout) works |
| Revenue or pipeline per session | GA4 or CRM | Which market deserves the next investment |
Pair each visibility metric with an outcome metric. A market with half the traffic and twice the conversion rate is often the better bet.
Step 4: compare markets fairly
Raw traffic favours big markets. For a fair comparison, look at efficiency and trend inside each market:
- Share of available demand: your impressions divided by the market’s search volume for your core terms, taken from a keyword tool set to that country.
- Trend: the month-over-month change in clicks and conversions for each language.
- Efficiency: conversions per 1,000 organic sessions.
Rank markets into three groups: invest (efficient and growing), fix (demand exists, results lag) and hold (small demand, fine as is). Re-rank every quarter, because algorithm updates, new competitors and your own new content keep changing the order.
Step 5: read the pattern and fix the right thing
| What you see | Likely cause | What to do |
|---|---|---|
| High impressions, low CTR | Titles and descriptions translated literally or not at all | Rewrite localized titles using local keywords; test two versions |
| Good rankings, little traffic | You rank for terms nobody searches in that language | Redo keyword research with a native speaker |
| Traffic but low conversion | Prices, payment methods, shipping or trust signals not localized | Review the full journey in that market, including checkout |
| Pages missing from the index | Hreflang errors, canonicals pointing to the English page, or blocked language folder | Audit hreflang reciprocity and canonicals; check robots rules |
| Wrong language ranking in a country | Missing or incorrect hreflang, no x-default | Fix hreflang and add x-default |
| Sudden drop in one language only | Deployment removed hreflang, a folder was noindexed, or translations stopped updating | Compare the page source before and after the drop |
For keyword work per market, see how to translate SEO keywords for different global audiences. For the structure decision, see subdirectories vs subdomains.
Step 6: turn analytics into a routine
- Once a month, spend about 30 minutes per language comparing clicks, impressions, CTR and conversions with the previous month, and look at the 10 pages gaining and losing the most.
- Once a quarter, re-rank markets, refresh keyword research for the top market, and review the lowest-CTR pages in each language.
- After every release, spot-check hreflang and canonicals on a few pages in each language.
Feed what you learn into the content plan. Publish more of what already works in a market, and send high-traffic, low-conversion pages to a native speaker for review. Our translation quality workflow explains how to organize that review.
How ConveyThis makes language versions measurable
Most measurement problems start upstream, with language versions that search engines cannot tell apart. ConveyThis multilingual SEO publishes each language on its own URL (subfolders, subdomains or ?lang, plus second-level domains on the Extreme plan), adds hreflang tags automatically, and translates page titles, meta descriptions and JSON-LD. Search Console and GA4 then have separate language versions to report on from the first day.
When the data turns up a problem, you fix it in the same tool: the visual editor for rewriting a weak translated title in context, a glossary to lock the local keywords you want used, and team roles so a native reviewer can own each language. Words are counted only when a translated page is shown to a visitor, and bots do not count, so search engine crawling does not eat into your plan.
Frequently asked questions
How do I measure multilingual SEO performance? Filter Search Console by each language’s URL folder or subdomain and by country, segment GA4 organic traffic by the same paths, and compare impressions, CTR, rankings, engagement and conversions per language.
Can I use GA4’s Language dimension to separate language versions? Not reliably. It reports the visitor’s browser or device language, not the version of your site they viewed. Use the page path, hostname or a content group instead.
Why does one language get impressions but few clicks? Usually because titles and meta descriptions were translated literally or left in the source language. Rewrite them around the terms local searchers use.
How often should I review multilingual SEO data? Monthly for trends and quick fixes, quarterly for market prioritization and keyword research.
If you would rather not build measurable language versions by hand, start with ConveyThis.












;fill-opacity:1;'%20d='M%2019.511719%2039.964844%20C%208.304688%2039.964844%200%2031.289062%200%2020.324219%20L%200%2020.230469%20C%200%209.363281%208.160156%200.46875%2019.847656%200.46875%20C%2027.023438%200.46875%2031.320312%202.878906%2034.847656%206.375%20L%2029.519531%2012.492188%20C%2026.59375%209.820312%2023.59375%208.179688%2019.800781%208.179688%20C%2013.390625%208.179688%208.761719%2013.53125%208.761719%2020.085938%20L%208.761719%2020.203125%20C%208.761719%2026.757812%2013.273438%2032.203125%2019.800781%2032.203125%20C%2024.144531%2032.203125%2026.808594%2030.46875%2029.808594%2027.722656%20L%2035.136719%2033.121094%20C%2031.199219%2037.335938%2026.855469%2039.964844%2019.511719%2039.964844%20'/%3e%3cpath%20style='%20stroke:none;fill-rule:nonzero;fill:rgb(26.274511%25,42.352942%25,94.901961%25);fill-opacity:1;'%20d='M%2035.878906%200.0351562%20L%2044.136719%200.0351562%20L%2044.136719%2039.867188%20L%2035.878906%2039.867188%20Z%20M%2035.878906%200.0351562%20'/%3e%3cpath%20style='%20stroke:none;fill-rule:nonzero;fill:rgb(26.274511%25,42.352942%25,94.901961%25);fill-opacity:1;'%20d='M%2059.472656%2016.15625%20C%2056.039062%2016.15625%2053.808594%2018.613281%2053.160156%2022.375%20L%2065.617188%2022.375%20C%2065.113281%2018.664062%2062.953125%2016.15625%2059.472656%2016.15625%20M%2073.535156%2027.578125%20L%2053.28125%2027.578125%20C%2054.097656%2031.335938%2056.710938%2033.3125%2060.40625%2033.3125%20C%2063.191406%2033.3125%2065.183594%2032.445312%2067.464844%2030.300781%20L%2072.191406%2034.492188%20C%2069.480469%2037.867188%2065.566406%2039.941406%2060.289062%2039.941406%20C%2051.527344%2039.941406%2045.070312%2033.769531%2045.070312%2024.832031%20L%2045.070312%2024.710938%20C%2045.070312%2016.347656%2051%209.480469%2059.472656%209.480469%20C%2069.191406%209.480469%2073.65625%2017.074219%2073.65625%2025.363281%20L%2073.65625%2025.457031%20C%2073.65625%2026.300781%2073.609375%2026.808594%2073.535156%2027.578125%20'/%3e%3cpath%20style='%20stroke:none;fill-rule:nonzero;fill:rgb(26.274511%25,42.352942%25,94.901961%25);fill-opacity:1;'%20d='M%2089.375%2039.796875%20L%2081.863281%2039.796875%20L%2070.390625%2010.324219%20L%2079.152344%2010.324219%20L%2085.679688%2029.914062%20L%2092.257812%2010.324219%20L%20100.847656%2010.324219%20Z%20M%2089.375%2039.796875%20'/%3e%3cpath%20style='%20stroke:none;fill-rule:nonzero;fill:rgb(26.274511%25,42.352942%25,94.901961%25);fill-opacity:1;'%20d='M%20111.550781%2016.15625%20C%20108.121094%2016.15625%20105.886719%2018.613281%20105.238281%2022.375%20L%20117.695312%2022.375%20C%20117.191406%2018.664062%20115.03125%2016.15625%20111.550781%2016.15625%20M%20125.617188%2027.578125%20L%20105.359375%2027.578125%20C%20106.175781%2031.335938%20108.792969%2033.3125%20112.488281%2033.3125%20C%20115.246094%2033.3125%20117.265625%2032.445312%20119.542969%2030.300781%20L%20124.273438%2034.492188%20C%20121.558594%2037.867188%20117.648438%2039.941406%20112.367188%2039.941406%20C%20103.609375%2039.941406%2097.152344%2033.769531%2097.152344%2024.832031%20L%2097.152344%2024.710938%20C%2097.152344%2016.347656%20103.078125%209.480469%20111.550781%209.480469%20C%20121.273438%209.480469%20125.734375%2017.074219%20125.734375%2025.363281%20L%20125.734375%2025.457031%20C%20125.734375%2026.300781%20125.6875%2026.808594%20125.617188%2027.578125%20'/%3e%3cpath%20style='%20stroke:none;fill-rule:nonzero;fill:rgb(26.274511%25,42.352942%25,94.901961%25);fill-opacity:1;'%20d='M%20143.566406%2018.757812%20C%20138.070312%2018.757812%20134.710938%2022.085938%20134.710938%2029.074219%20L%20134.710938%2039.867188%20L%20126.457031%2039.867188%20L%20126.457031%2010.613281%20L%20134.710938%2010.613281%20L%20134.710938%2016.519531%20C%20136.390625%2012.46875%20139.128906%209.867188%20144%2010.085938%20L%20144%2018.757812%20Z%20M%20143.566406%2018.757812%20'/%3e%3c/g%3e%3c/svg%3e)




;fill-opacity:1;'%20d='M%20144.558594%2039.894531%20L%20155.4375%209.839844%20C%20155.4375%209.839844%20147.28125%209.839844%20139.121094%2011.515625%20L%20128.867188%2039.894531%20Z%20M%20142.675781%201.78125%20L%20140.585938%207.539062%20C%20148.738281%205.863281%20156.902344%205.863281%20156.902344%205.863281%20L%20158.992188%200.105469%20C%20158.992188%200.105469%20150.832031%200.105469%20142.675781%201.78125%20M%2085.980469%2032.773438%20C%2090.898438%2033.71875%2095.914062%2034.136719%20101.039062%2034.136719%20C%20106.375%2034.136719%20110.140625%2032.984375%20110.554688%2029.320312%20C%20110.765625%2027.640625%20109.089844%2026.382812%20106.167969%2024.707031%20C%20102.816406%2022.824219%2099.894531%2021.878906%2096.960938%2019.886719%20C%2094.03125%2017.898438%2092.78125%2014.859375%2093.71875%2011.507812%20C%2094.871094%207.636719%2097.585938%205.4375%20101.664062%203.34375%20C%20106.480469%200.9375%20110.242188%20-0.0078125%20119.550781%20-0.0078125%20C%20125.40625%20-0.0078125%20131.054688%200.515625%20136.597656%201.667969%20L%20134.609375%207.113281%20C%20129.691406%206.167969%20124.675781%205.75%20119.550781%205.75%20C%20114.214844%205.75%20110.453125%206.90625%20110.035156%2010.570312%20C%20109.828125%2012.246094%20111.5%2013.503906%20114.425781%2015.179688%20C%20117.773438%2017.066406%20120.695312%2018.011719%20123.628906%2020%20C%20126.558594%2021.988281%20127.808594%2025.027344%20126.871094%2028.378906%20C%20125.71875%2032.253906%20123.003906%2034.449219%20118.925781%2036.542969%20C%20114.113281%2038.949219%20110.347656%2039.894531%20101.039062%2039.894531%20C%2095.183594%2039.894531%2089.535156%2039.375%2083.992188%2038.21875%20Z%20M%2062.34375%2039.894531%20L%2071.441406%2014.867188%20C%2074.476562%206.488281%2063.390625%209.527344%2060.875%2011.515625%20C%2058.890625%2012.984375%2055.332031%2016.441406%2054.078125%2020.105469%20L%2046.859375%2040%20L%2031.175781%2040%20L%2040.273438%2014.867188%20C%2043.308594%206.488281%2032.222656%209.527344%2029.710938%2011.515625%20C%2027.722656%2012.984375%2024.167969%2016.441406%2022.910156%2020.105469%20L%2015.691406%2040%20L%200.0078125%2040%20L%2014.441406%200.105469%20C%2019.464844%200.105469%2022.179688%201.257812%2024.375%203.457031%20C%2025.207031%204.289062%2025.734375%205.339844%2026.046875%206.496094%20C%2028.980469%204.714844%2031.589844%203.351562%2033.371094%202.726562%20C%2036.613281%201.46875%2040.691406%200.105469%2045.714844%200.105469%20C%2050.734375%200.105469%2053.453125%201.257812%2055.644531%203.457031%20C%2056.480469%204.289062%2057.007812%205.339844%2057.320312%206.496094%20C%2060.25%204.714844%2062.863281%203.351562%2064.640625%202.726562%20C%2067.886719%201.46875%2071.964844%200.113281%2076.984375%200.113281%20C%2082.007812%200.113281%2084.722656%201.265625%2086.917969%203.464844%20C%2089.21875%205.660156%2089.113281%209.742188%2088.28125%2012.050781%20L%2078.027344%2039.902344%20L%2062.34375%2039.902344%20Z%20M%2062.34375%2039.894531%20'/%3e%3c/g%3e%3c/svg%3e)

;fill-opacity:1;'%20d='M%202.453125%209.882812%20L%202.453125%2012.851562%20L%207.304688%2012.851562%20L%2016.800781%2030.734375%20L%2028.488281%2030.734375%20L%2037.980469%2012.824219%20L%2042.832031%2012.792969%20L%2042.84375%209.882812%20L%2028.328125%209.882812%20L%2028.328125%2012.804688%20L%2032.195312%2012.804688%20L%2025.488281%2025.515625%20L%2018.234375%2012.847656%20L%2023.527344%2012.824219%20L%2023.515625%209.882812%20Z%20M%2096.097656%209.882812%20L%2096.097656%2012.851562%20L%20100.949219%2012.851562%20L%20110.445312%2030.734375%20L%20122.128906%2030.734375%20L%20131.625%2012.824219%20L%20136.476562%2012.792969%20L%20136.484375%209.882812%20L%20121.972656%209.882812%20L%20121.972656%2012.804688%20L%20125.835938%2012.804688%20L%20119.132812%2025.515625%20L%20111.878906%2012.847656%20L%20117.167969%2012.824219%20L%20117.160156%209.882812%20Z%20M%2072.222656%209.882812%20L%2072.222656%2012.851562%20L%2077.078125%2012.851562%20L%2077.082031%2027.453125%20L%2071.96875%2027.453125%20L%2071.96875%2030.707031%20L%2077.085938%2030.734375%20L%20101.3125%2030.734375%20L%20101.3125%2021.027344%20L%2098.15625%2021.027344%20C%2097.984375%2026.167969%2093.542969%2027.457031%2091.675781%2027.457031%20C%2089.960938%2027.457031%2086.640625%2027.453125%2086.640625%2027.453125%20L%2086.640625%2012.847656%20L%2091.417969%2012.824219%20L%2091.410156%209.882812%20Z%20M%2055.890625%209.285156%20C%2047.644531%209.285156%2040.960938%2014.214844%2040.960938%2020.292969%20C%2040.960938%2026.375%2047.644531%2031.304688%2055.890625%2031.304688%20C%2064.136719%2031.304688%2070.824219%2026.375%2070.824219%2020.292969%20C%2070.824219%2014.214844%2064.136719%209.285156%2055.890625%209.285156%20Z%20M%2055.675781%2028.0625%20C%2052.769531%2028.0625%2050.414062%2024.566406%2050.414062%2020.25%20C%2050.414062%2015.933594%2052.769531%2012.4375%2055.675781%2012.4375%20C%2058.582031%2012.4375%2060.941406%2015.933594%2060.941406%2020.25%20C%2060.941406%2024.566406%2058.582031%2028.0625%2055.675781%2028.0625%20Z%20M%20149.539062%208.921875%20C%20141.289062%208.921875%20134.605469%2013.933594%20134.605469%2020.113281%20C%20134.605469%2026.292969%20141.289062%2031.300781%20149.539062%2031.300781%20C%20157.78125%2031.300781%20164.46875%2026.292969%20164.46875%2020.113281%20C%20164.46875%2013.933594%20157.78125%208.921875%20149.539062%208.921875%20Z%20M%20149.324219%2028.007812%20C%20146.417969%2028.007812%20144.0625%2024.453125%20144.0625%2020.066406%20C%20144.0625%2015.679688%20146.417969%2012.125%20149.324219%2012.125%20C%20152.230469%2012.125%20154.585938%2015.679688%20154.585938%2020.066406%20C%20154.585938%2024.453125%20152.230469%2028.007812%20149.324219%2028.007812%20Z%20M%20149.324219%2028.007812%20'/%3e%3c/g%3e%3c/svg%3e)